Recently, we got our hands on the TSE benchmarks for most of the high end GPUs from NVIDIA’s RTX 4000 ‘Ada Lovelace‘ lineup. Today, @QbitLeaks gave us some expected performance numbers for the mid-low end Lovelace GPUs (4060 and 4060 Ti).
An Overview
A leaked initial configuration shows us that the RTX 4060 is powered by the AD106 GPU featuring 4352 Cuda Cores. Whereas, the -Ti variant features NVIDIA’s AD104 chip while boasting an impressive 6656 Cuda Cores.

Performance Metrics
Lets get straight to the benchmarks, shall we? QBitLeaks shares that the RTX 4060 and 4060 Ti have been ‘allegedly’ tested. The keyword here is ‘allegedly‘, we’ll get onto that in a bit.
The RTX 4060 Ti scores ~8600 points in TSE (Time Spy Extreme) while consuming 270–280W of power (2600MHz-2700MHz). The lower RTX 4060 pumps out 6000 points in the same test, however, the power draw is still 230–240W (2700-2800MHz).
Well it seems 4060 and 4060 Ti have been tested
4060 Ti: TSE ~8600, avg clock 26XX, power draw ~270-280W.
4060: TSE ~6000, avg clock 27XX, power draw ~230-240W.
— FCL (@QbitLeaks) August 26, 2022
For reference, lets compare these numbers against the previously leaked GPUs to give us some idea regarding relative performance.
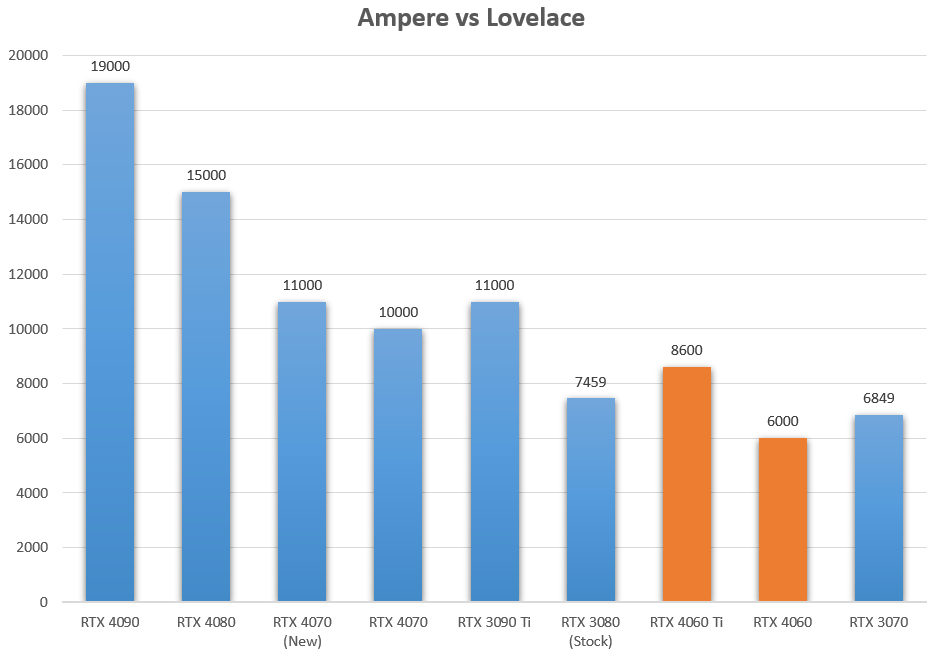
The RTX 4060 Ti is around 15-20% faster than the RTX 3080. That’s insane! However, the RTX 4060 is yet again a mystery. Just 20-30 less watts of power, and your performance drops by 30%. The 4060 falls short of even the RTX 3070, scoring just 1-2% better than the 3060 Ti.
- RTX 4060 Ti > RTX 3080 by 15%
- RTX 3070 > RTX 4060 Ti >= RTX 3060 Ti
The Efficiency Disaster
Lovelace has proven to be one of the most efficient generations NVIDIA is planning to launch. Although the power consumption remains high, we still have massive gains for each watt of power consumed.

The RTX 4060 Ti still remains in the high 30s, however, we see a continuous downward trend.
The Discrepancy
NVIDIA’s -60 lineup is always targeted for the 150-200W market. Seldom do we see these GPUs hitting the 200W territory and that too only occurs with the -Ti refreshes. The ‘leaked’ TDPs do not make sense at all because this puts the RTX 4050 at around 180-200W of power which is absurd. Therefore, take these leaks with a grain of salt.
Have a look at these charts:

Meanwhile, for Ampere the efficiency is kept nearly constant. Decreases are only seen when extremely high power consumption is required (RTX 3090 Ti, RTX 3080). Moving on to Lovelace, as the performance decreases, so does the efficiency.

The post NVIDIA RTX 4060 Ti and 4060 Benchmarks Surface, Expect RTX 3080 Level Performance appeared first on Appuals.com.


0 Commentaires